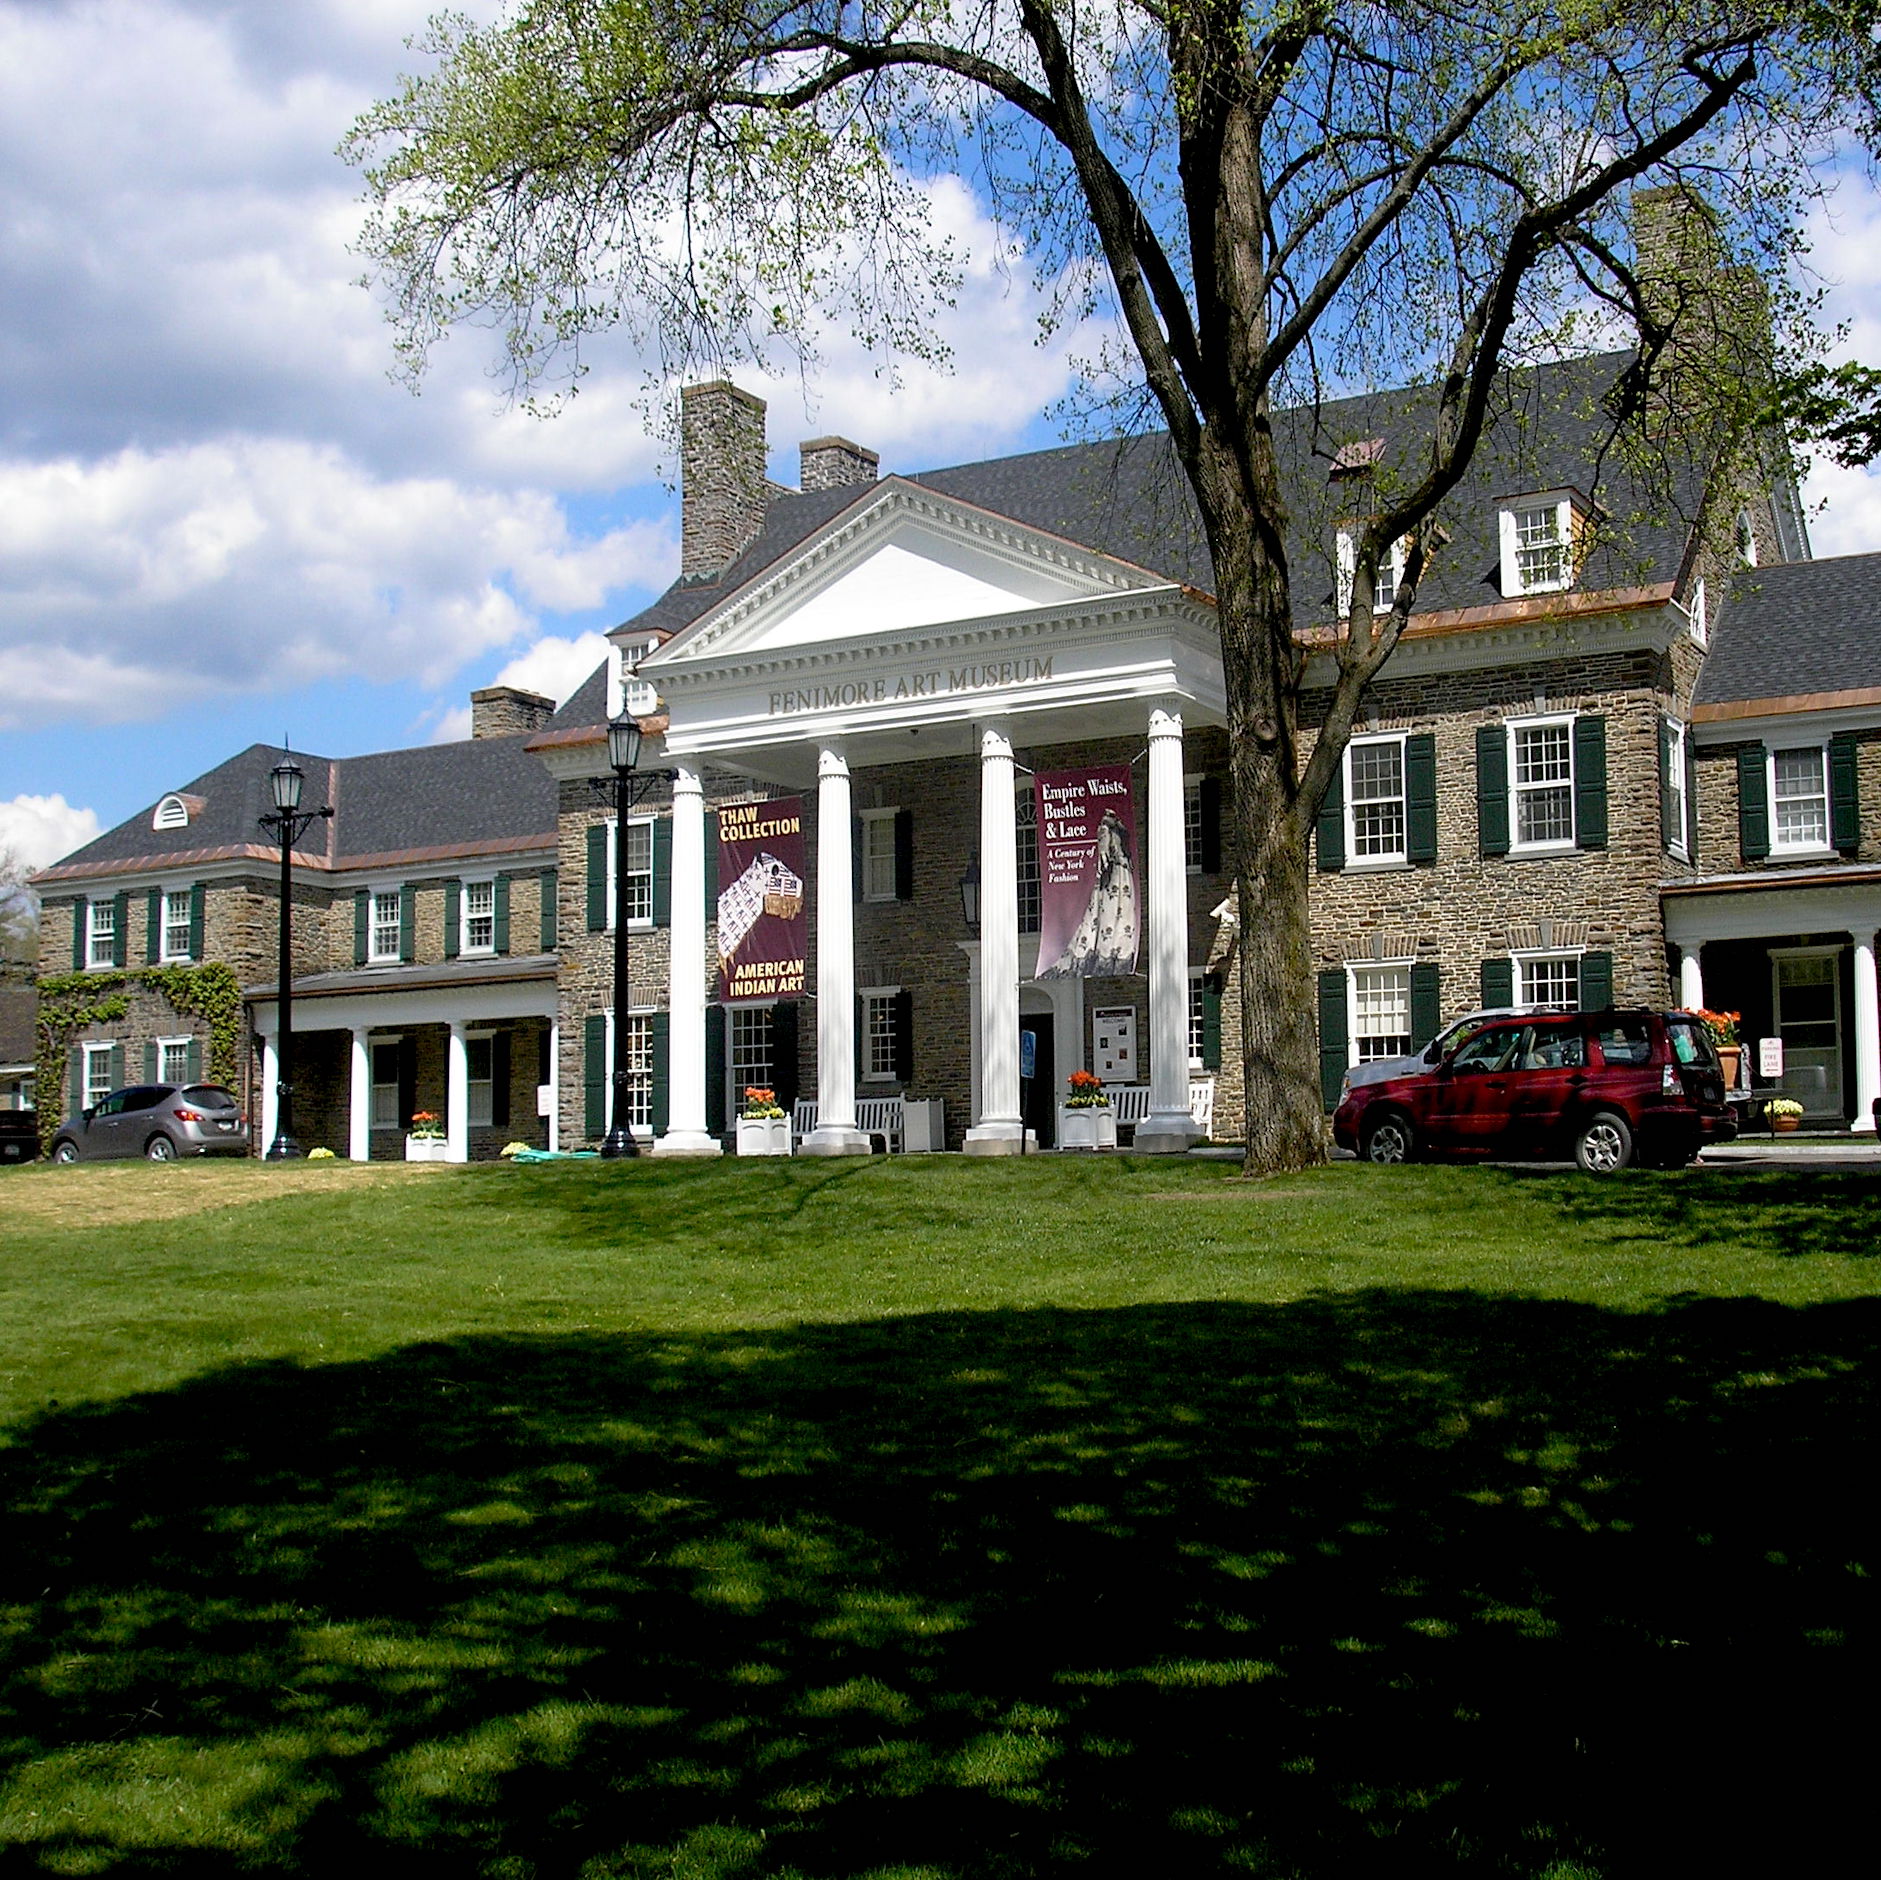
Fenimore Art Museum – Cooperstown, NY
Challenge
The marketing director wanted to understand the connection between different advertising channels (radio, tv, digital and print) and ticket sales during a major exhibit run.
Datasets
2015 Visitor Zip Codes (May – September 2015)
2015 Exhibit Advertising Expenses
Analysis
This event ticket analysis started by splitting visitors into two geographical areas (east coast ticket sales and west coast ticket sales). Then the top 30 zip codes from each geographical area were ranked. Followed by the advertising expenses spent in each respective area or market.
Results
Though most museum marketing professionals agree that digital marketing is the future, this visual report showcased that the top 10 visitor zip codes all featured radio advertisements. There could be many other factors that could relate to high attendance rates, however it should be noted that zip codes that traditionally had higher visitation dropped in attendance during this exhibit. The main difference being a lack of radio advertising in those respective markets.


